Download your data
You can get access to your own electricity and gas usage data from https://www.citipower.com.au/our-services/myenergy. You will need a copy of your power bill, which has your smart meter number and meter id, to register for an account.
Reading the data
The data structure is described here.
The data is not especially nicely formatted (surprise). The main components are:
- The time resolution is half-hourly. And values for each day are spread across the columns.
- The first column has an id variable which indicates what type of information is in the row. If it is “200” is indicates a new meter. You may have multiple meters running, and hence multiple recordings per day. Only id’s equal to “300” are actually measurements.
The code to read the data does the following steps:
- Skip the first row
- Check the number of meters, create a meter id and day index for each meter
- Filter only rows with id “300”
- Gather the data into long form, to create a variable indicating the half hourly intervals, and the kwh in each.
- Create some new time variables, day, month, year.
Calendar plots
A nice way to look at this data is using Earo Wang’s calendar plot functions from her R package sugrrants.
Below are the calendar plots for the two meters that are running at my apartment.
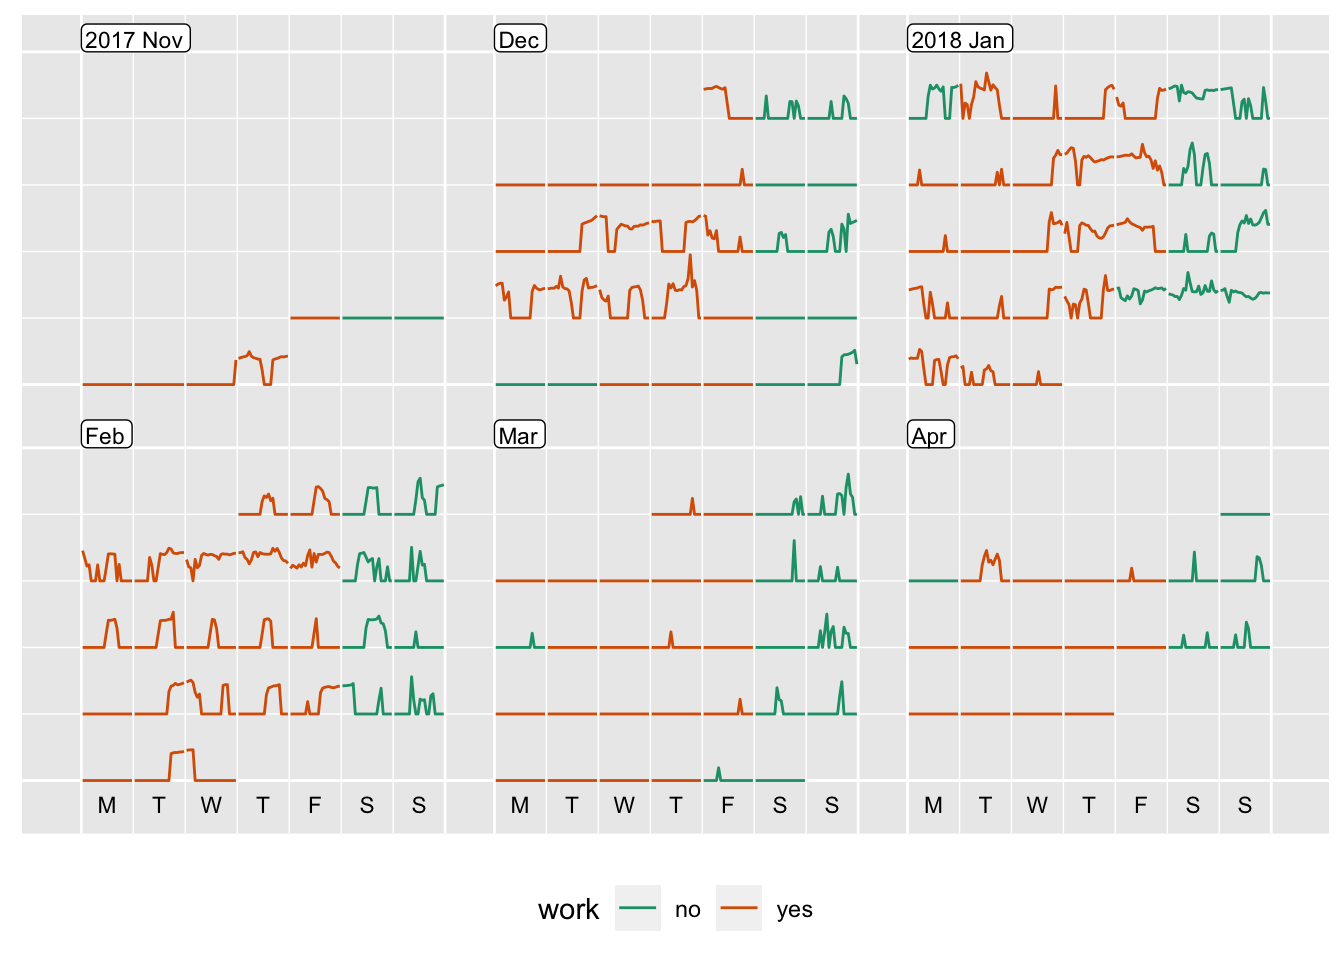
Meter 1
Meter 1 seems to be the daily activity. You can see
- We move into the apartment Nov 30. We were supposed to move in Nov 24, but a mess up with the loan documents delayed this for almost a week.
- There is more usage in Dec-Feb, primarily because we had the air conditioner running probably a little too much.
- Usage in Mar an April is more on weekends (or non work days).
- You can see a number of zero usage days, when we were away for the Christmas period, arriving back late New Year’s Eve, or snorkelling on the peninsula for the day.
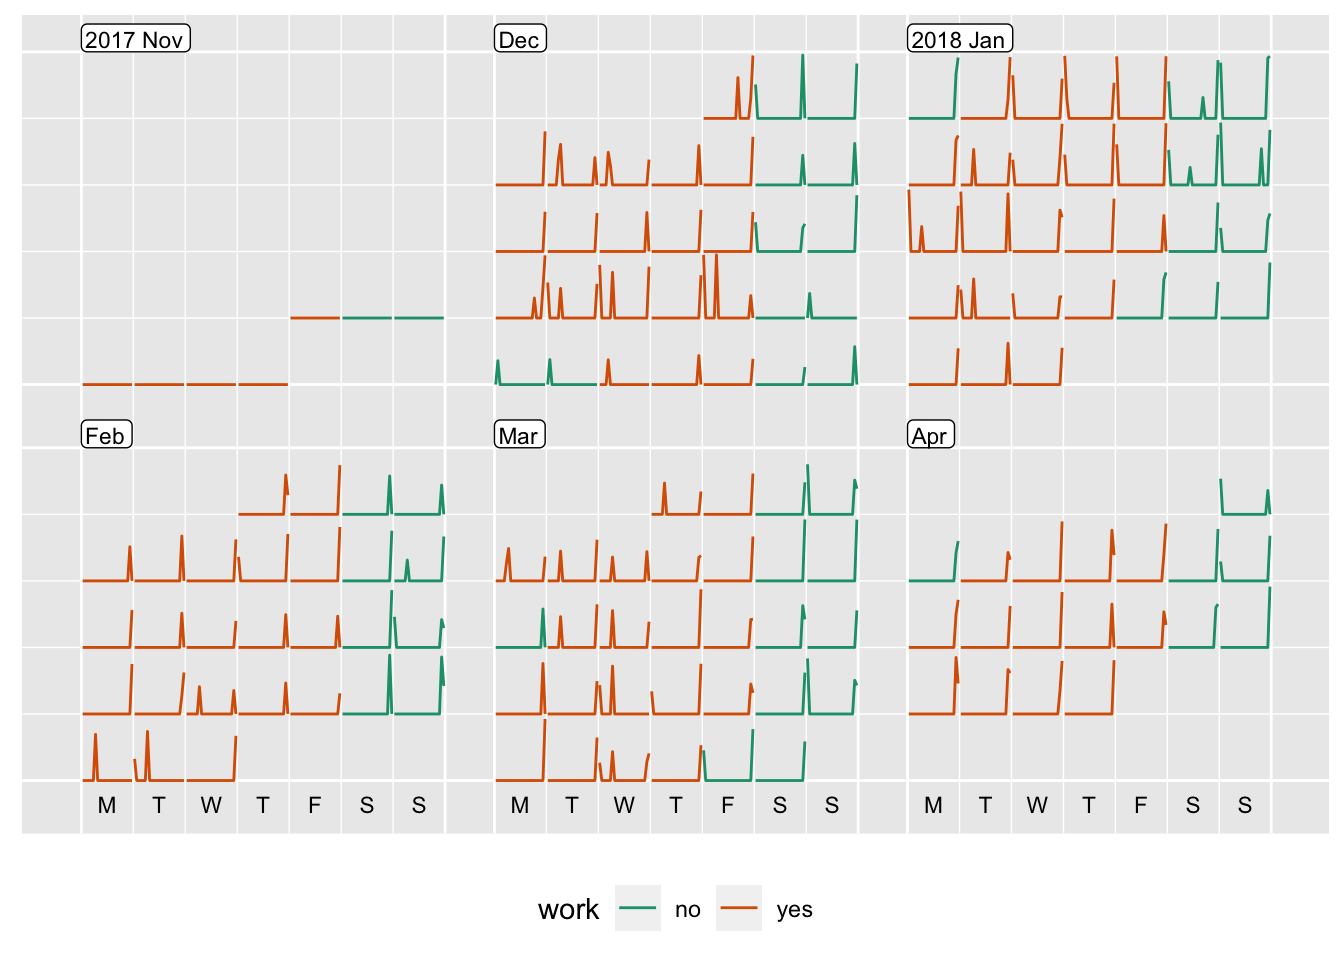
Meter 2
This meter seems to show regular use, not related to our activity. It comes on late at night, every day, and sometimes has an extra early peak also. I suspect the water heater is on this meter, alone. This is something that I could check, I guess.
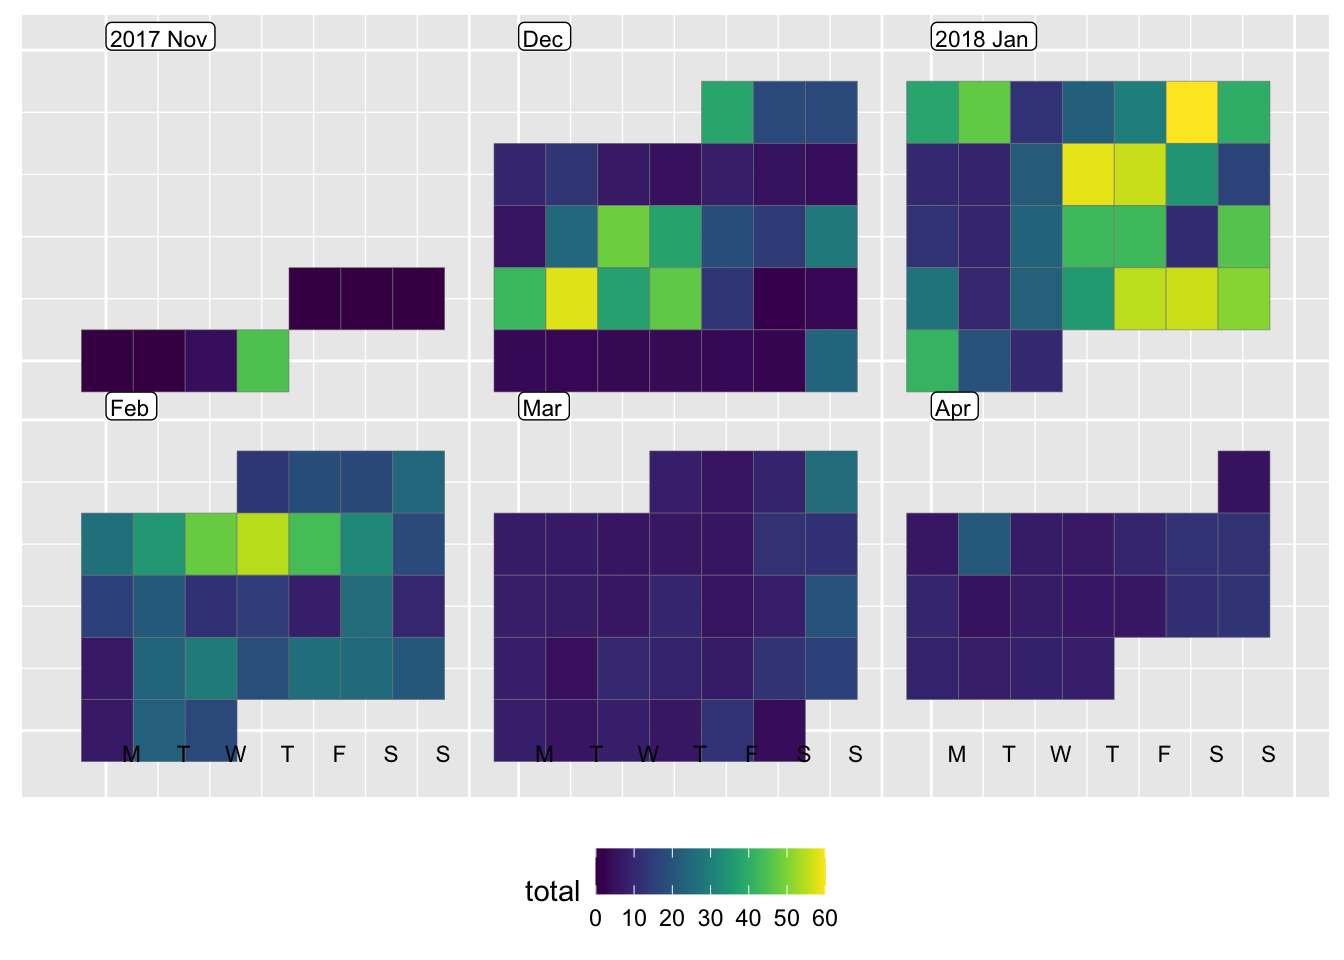
Total usage
The plot below shows total daily usage. The heavy usage in January, December before holidaying at Christmas, and a few days in February, are clearer to see using the heatmap calendar.
Understanding our usage, is difficult, given that our son was visiting from the US. The high peak in daily usage Monday, Dec 18 was when he arrived. He has high internet usage, and likes long showers. Its hard to tell if there was an effect, because there were plenty of high usage days when he wasn’t around. It seems to be mostly the weather-related air conditioning usage. Will be interesting to see how heating affects the winter electricity use.