Statistics on Street Corners: Conducting Inference for Data Plots
Di Cook
Monash University
NCB2021
June 22, 2021
https://dicook.org/files/NCB2021/slides.html
Image credit: Di Cook, 2018
Hello 👋🏻
Hello 👋🏻

Hello 👋🏻

Data plots are often to make decisions, especially for deciding on whether a model fits. They can and should be integrated into the classical statistics infrastructure.
I'm going to talk about
I'm going to talk about
inference for data plots
I'm going to talk about
inference for data plots
examples, deer sightings in the wild, gene expression, making disease maps, and RNA-seq
I'm going to talk about
inference for data plots
examples, deer sightings in the wild, gene expression, making disease maps, and RNA-seq
and how you can do this too.
Inference for data plots requires
- the plot is a statistic
Inference for data plots requires
- the plot is a statistic
- the type of plot (specified by a grammar) implicitly defines the null hypothesis
Inference for data plots requires
- the plot is a statistic
- the type of plot (specified by a grammar) implicitly defines the null hypothesis
- a null generating mechanism provides draws from the sampling distribution, among which to embed the data plot
Inference for data plots requires
- the plot is a statistic
- the type of plot (specified by a grammar) implicitly defines the null hypothesis
- a null generating mechanism provides draws from the sampling distribution, among which to embed the data plot
- human (computer) observers are engaged to conduct a lineup test
- statistical significance and power can be computed based on the proportion of observers choosing the data plot from the lineup
Why is a plot a statistic?
Many of you (hopefully) use ggplot2 to make your plots with a grammar of graphics.
ggplot(data=DATA) + geom_something( mapping=aes(x=VAR1, y=VAR2, colour=VAR3) ) + extra nice stylingWhy is a plot a statistic?
Many of you (hopefully) use ggplot2 to make your plots with a grammar of graphics.
ggplot(data=DATA) + geom_something( mapping=aes(x=VAR1, y=VAR2, colour=VAR3) ) + extra nice stylingA statistic is a function of a random variable(s). This is how the mapping can be interpreted.
Adding data gives a visual statistic
# Get some datalibrary(amt)data("deer")data("sh_forest")rsf1 <- deer %>% random_points(n=1500) %>% extract_covariates(sh_forest) %>% mutate(forest = sh.forest == 1) %>% rename(x=x_, y=y_, sighted=case_)# Plot itggplot(data=rsf1) + geom_point( aes(x=x, y=y, colour=sighted), alpha=0.7) + extra nice stylingObserved value of the statistic

ggplot(rsf1) + geom_bar( aes(x=sighted, fill=forest), position = "fill") + extra nice stylingFor sighted vs forest habitat the mapping requires call to stat=count:
## # A tibble: 4 x 3## # Groups: sighted [2]## sighted forest count## <lgl> <lgl> <int>## 1 FALSE FALSE 1208## 2 FALSE TRUE 292## 3 TRUE FALSE 560## 4 TRUE TRUE 266Observed value of statistic

Null generating mechanism: Example 1
What's the null? What would be uninteresting?
ggplot(DATA) + geom_POINT( aes(x=x, y=y, colour=sighted), alpha=0.7) + extra nice stylingNull generating mechanism: Example 1
What's the null? What would be uninteresting?
ggplot(DATA) + geom_POINT( aes(x=x, y=y, colour=sighted), alpha=0.7) + extra nice stylingHo: Sightings are uniformly distributed in space
Ha: Sightings are NOT uniformly distributed in space
Null generating mechanism could be to permute the labels of sighted variable. (Or could simulated a second uniform set of points.)
Null generating mechanism: Example 2
What's the null? What would be uninteresting?
ggplot(DATA) + geom_BAR( aes(x=sighted, fill=forest), position = "fill") + extra nice stylingNull generating mechanism: Example 2
What's the null? What would be uninteresting?
ggplot(DATA) + geom_BAR( aes(x=sighted, fill=forest), position = "fill") + extra nice stylingHo: No relationship between sighted and forest habitat
Ha: Sightings in forest habitat more likely
Null generating mechanism could also be permute the labels of sighted (or forest) variable. (Or could simulate from a binomial.)
Pretend you haven't seen the data plot
Which plot is different from the rest?
set.seed(20210622)library(nullabor)l <- lineup(null_permute("sighted"), rsf1, n=6)ggplot(l) + geom_point( aes(x=x, y=y, colour=sighted), alpha=0.3) + facet_wrap(~.sample, ncol=2) + extra nice styling
Which plot is different from the rest?
set.seed(20210622)library(nullabor)l <- lineup(null_permute("sighted"), rsf1, n=6)ggplot(l) + geom_point( aes(x=x, y=y, colour=sighted), alpha=0.3) + facet_wrap(~.sample, ncol=2) + extra nice styling
You say 1? Oh, that is the data plot.
set.seed(20210622)l <- lineup(null_permute("sighted"), rsf1, n=9)ggplot(l) + geom_bar( aes(x=sighted, fill=forest), position = "fill") + facet_wrap(~.sample, ncol=3) + extra nice stylingIn which plot is the light brown bar on the right the tallest?

set.seed(20210622)l <- lineup(null_permute("sighted"), rsf1, n=9)ggplot(l) + geom_bar( aes(x=sighted, fill=forest), position = "fill") + facet_wrap(~.sample, ncol=3) + extra nice stylingIn which plot is the light brown bar on the right the tallest?

Did you say 5? You're good!
In each case, the data plot was identifiable, and the null hypothesis would be rejected
Inference for graphics infrastructure
Visual inference broadens the scope of statistics
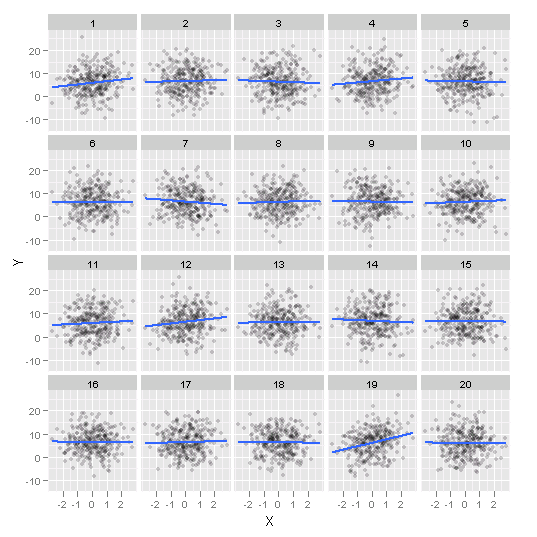
Let's do an actual lineup test
Lineup protocol
I'm going to show you a page of plots
Lineup protocol
I'm going to show you a page of plots
Each has a number above it, this is its id
Lineup protocol
I'm going to show you a page of plots
Each has a number above it, this is its id
Choose the plot that you think exhibits the most separation between groups
Lineup protocol
I'm going to show you a page of plots
Each has a number above it, this is its id
Choose the plot that you think exhibits the most separation between groups
If you really need to choose more than one, or even not choose any, that is ok, too
Lineup protocol
I'm going to show you a page of plots
Each has a number above it, this is its id
Choose the plot that you think exhibits the most separation between groups
If you really need to choose more than one, or even not choose any, that is ok, too
Ready?
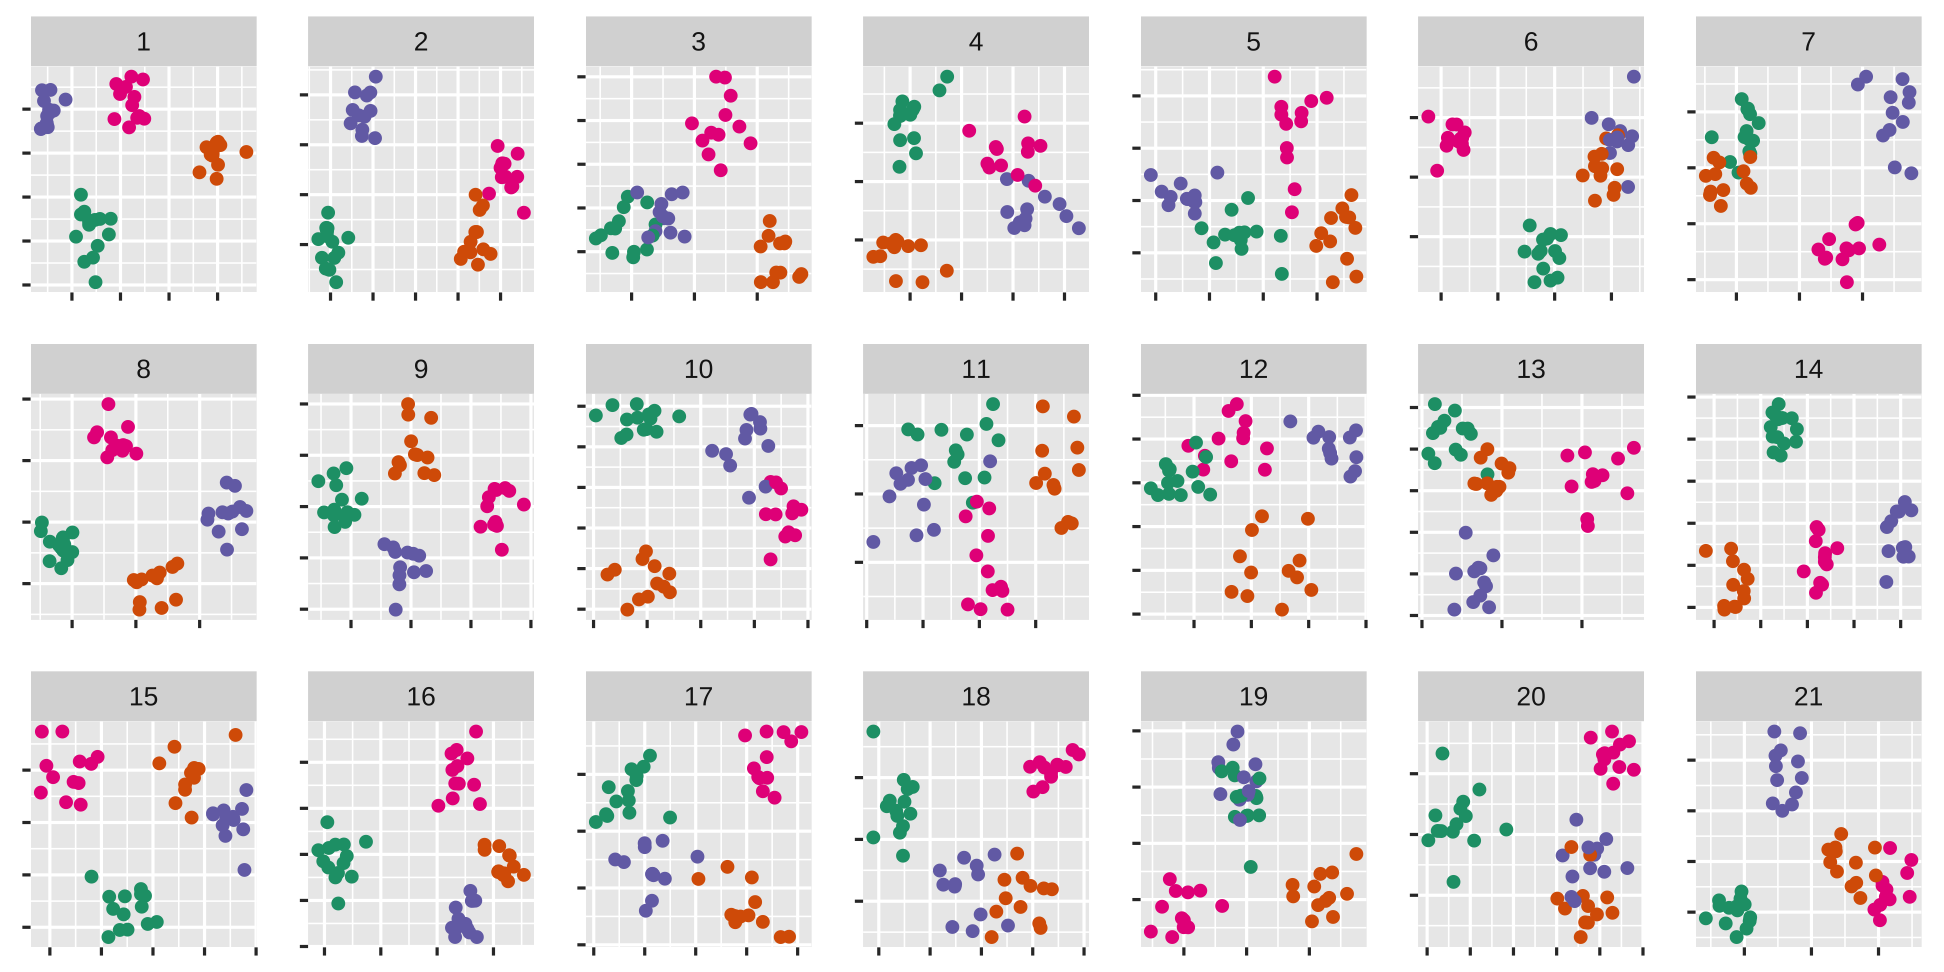
The data plot is
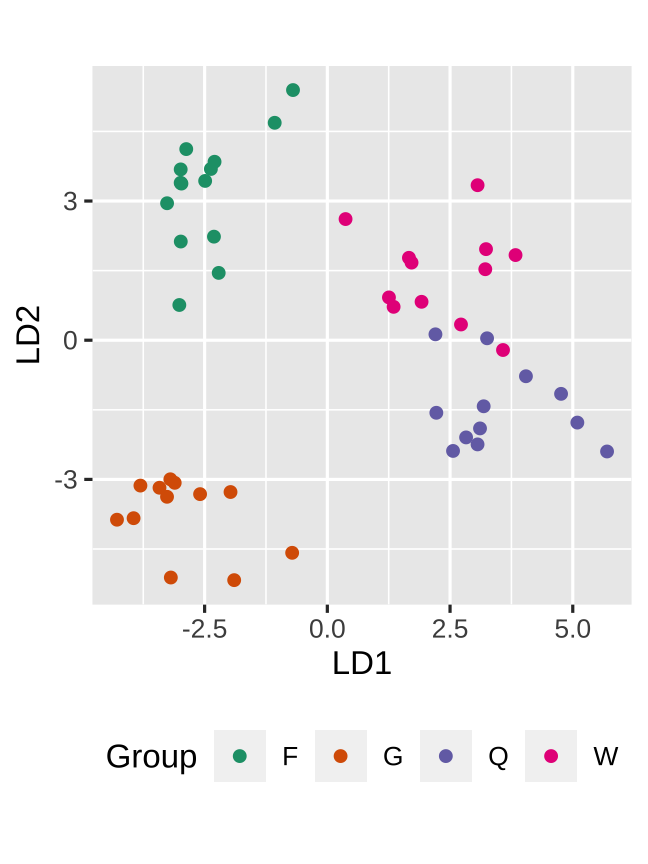
My guess is that you didn't picked this one?
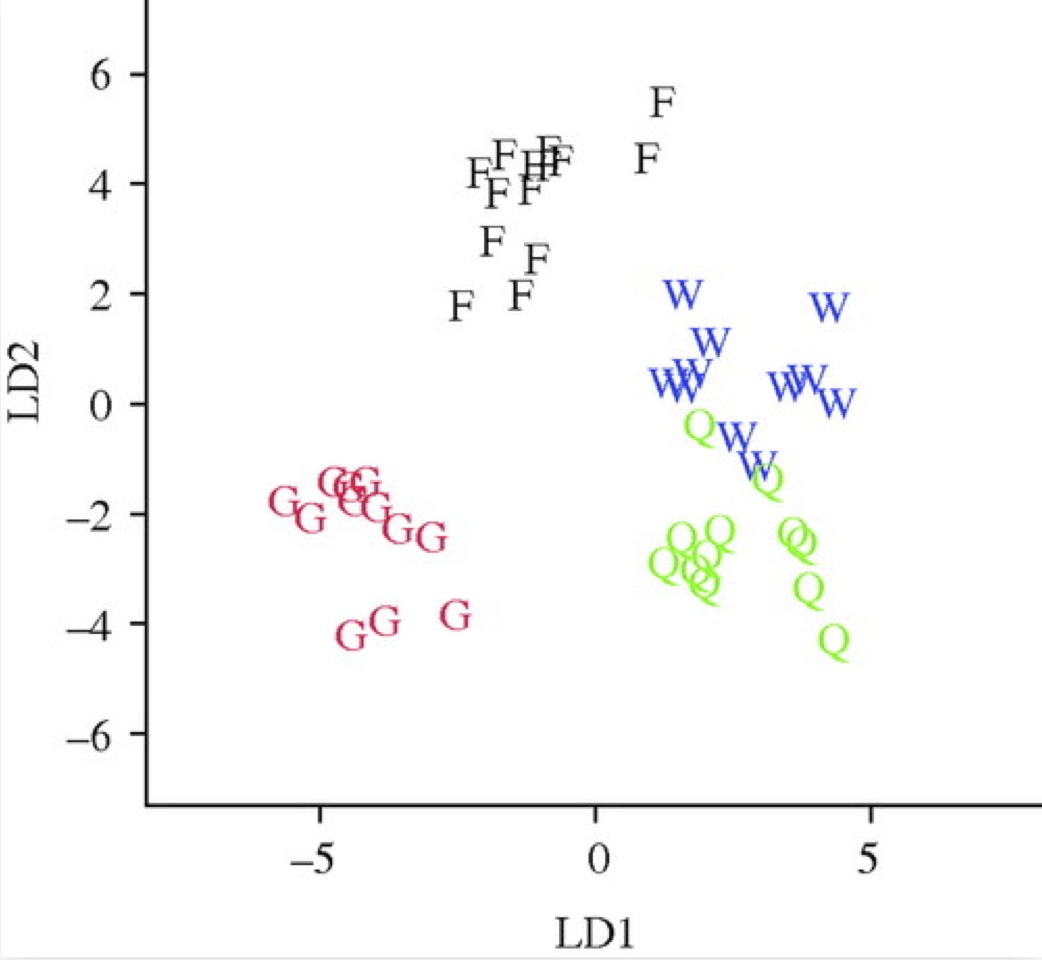
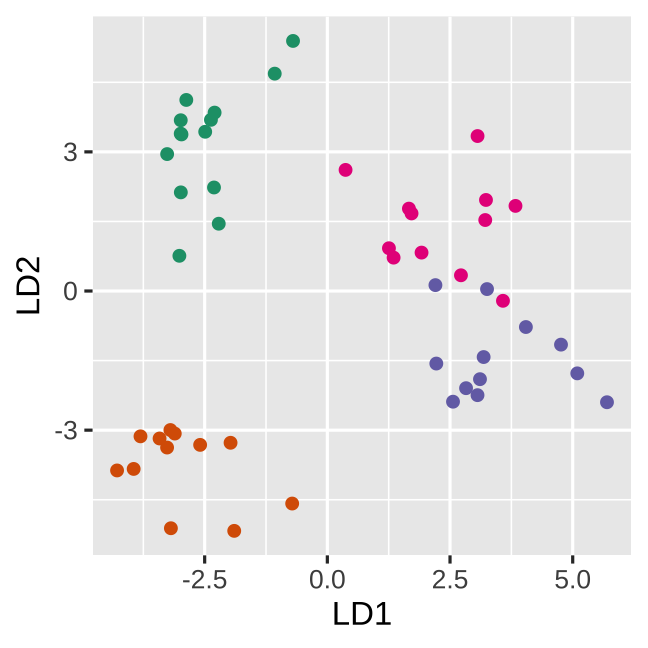
LDA resulted in ... that gynes had the most divergent expression patterns
Toth et al (2010) Proc. of the Royal Society

LDA resulted in ... that gynes had the most divergent expression patterns
Toth et al (2010) Proc. of the Royal Society
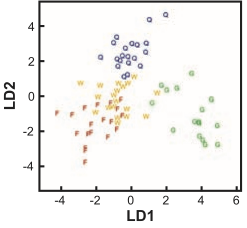
... show that foundress and worker brain profiles are more similar to each other than to the other groups.
Toth et al (2007) Science
True data
Null data
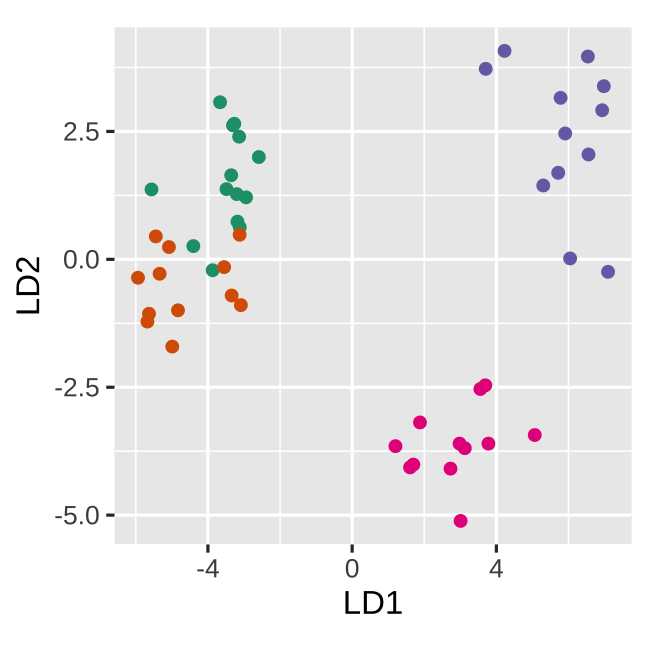
Space is big, and with few data points, classes can easily be separated
Space is big, and with few data points, classes can easily be separated
spuriously.
Space is big, and with few data points, classes can easily be separated
spuriously.
The lineup protocol can help people understand the problem.
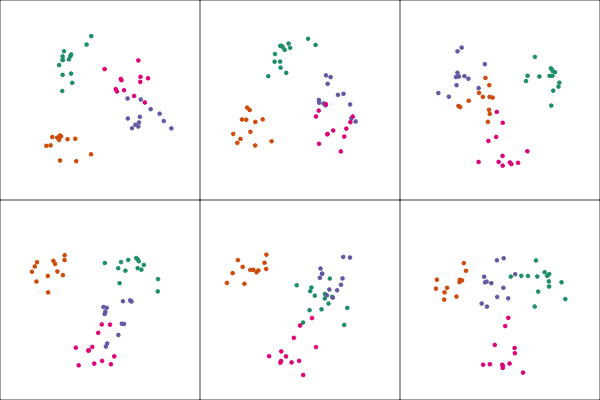
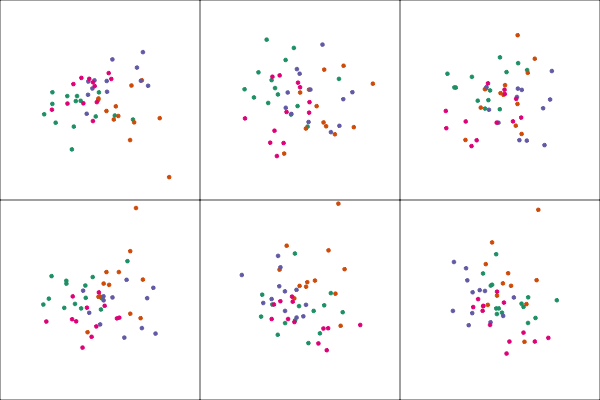
If you first do dimension reduction (e.g. PCA), and then LDA, the problem goes away. LDA into three dimensions shown below.
All data
Top 12 PCs
Let's do another actual lineup test
Lineup protocol
I'm going to show you a page of plots
Lineup protocol
I'm going to show you a page of plots
Each has a number above it, this is its id
Lineup protocol
I'm going to show you a page of plots
Each has a number above it, this is its id
Choose the plot that you think exhibits the most separation between groups
Lineup protocol
I'm going to show you a page of plots
Each has a number above it, this is its id
Choose the plot that you think exhibits the most separation between groups
If you really need to choose more than one, or even not choose any, that is ok, too
Lineup protocol
I'm going to show you a page of plots
Each has a number above it, this is its id
Choose the plot that you think exhibits the most separation between groups
If you really need to choose more than one, or even not choose any, that is ok, too
Ready?
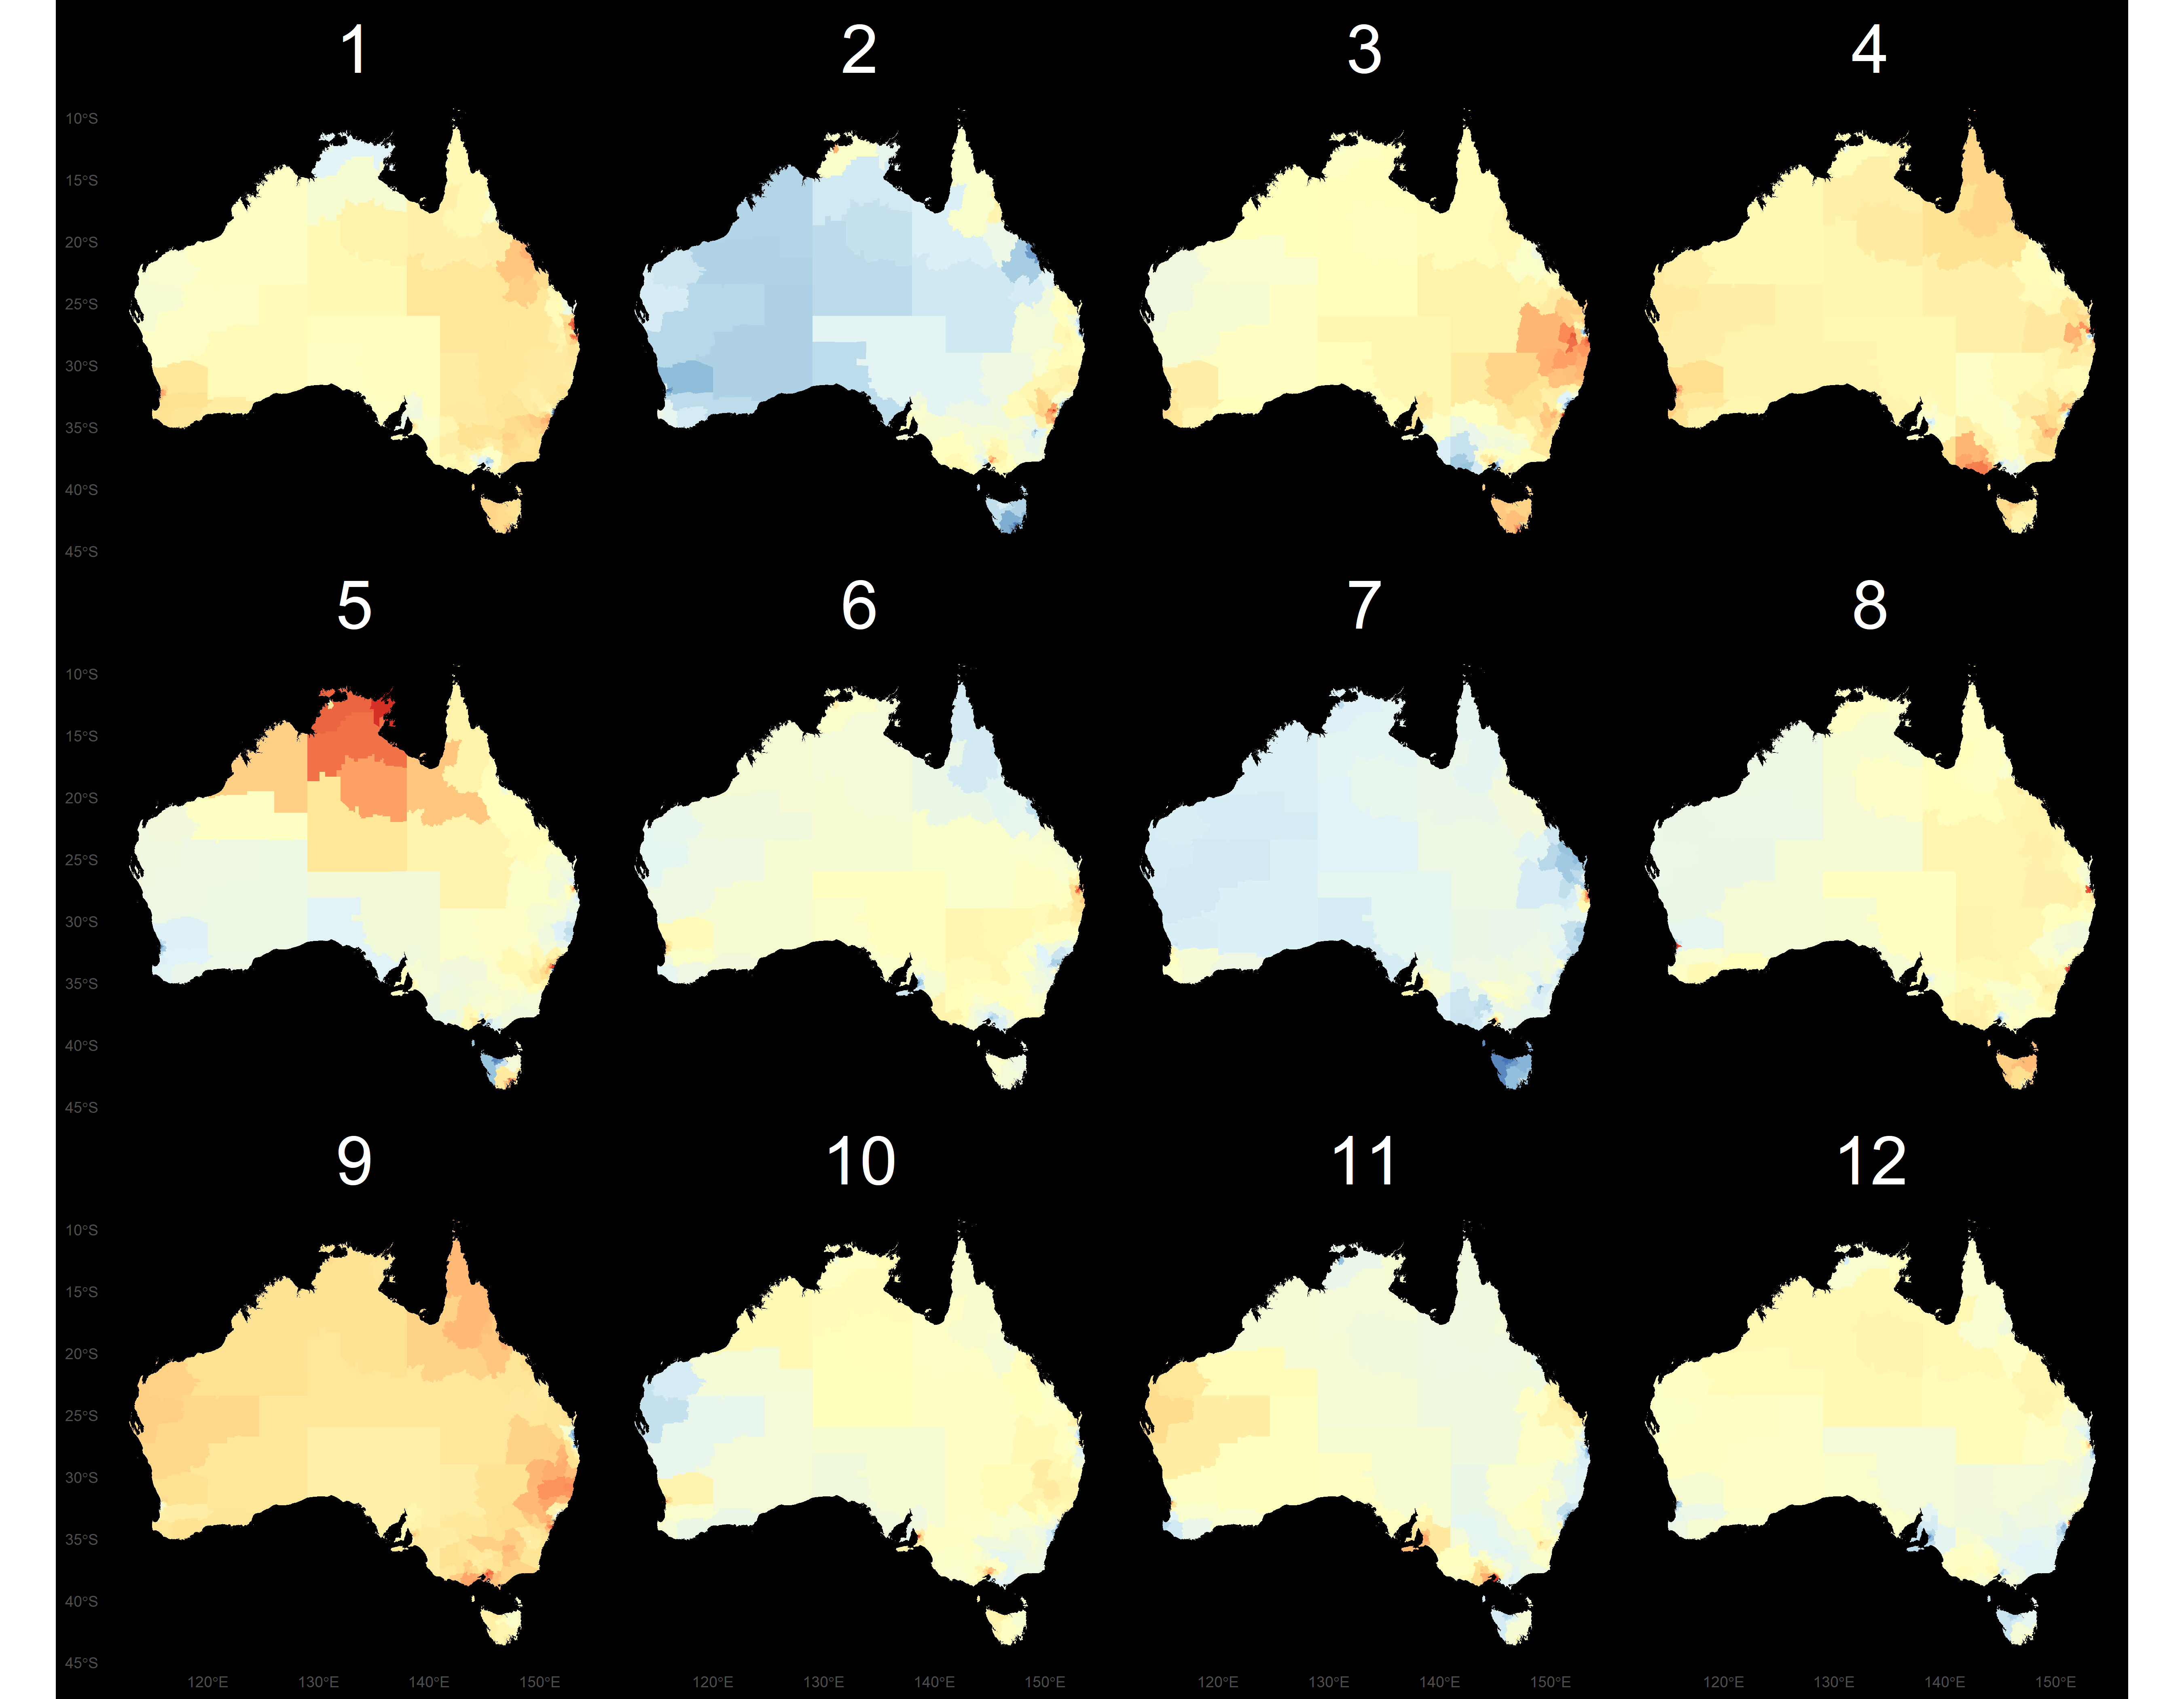
Try another one
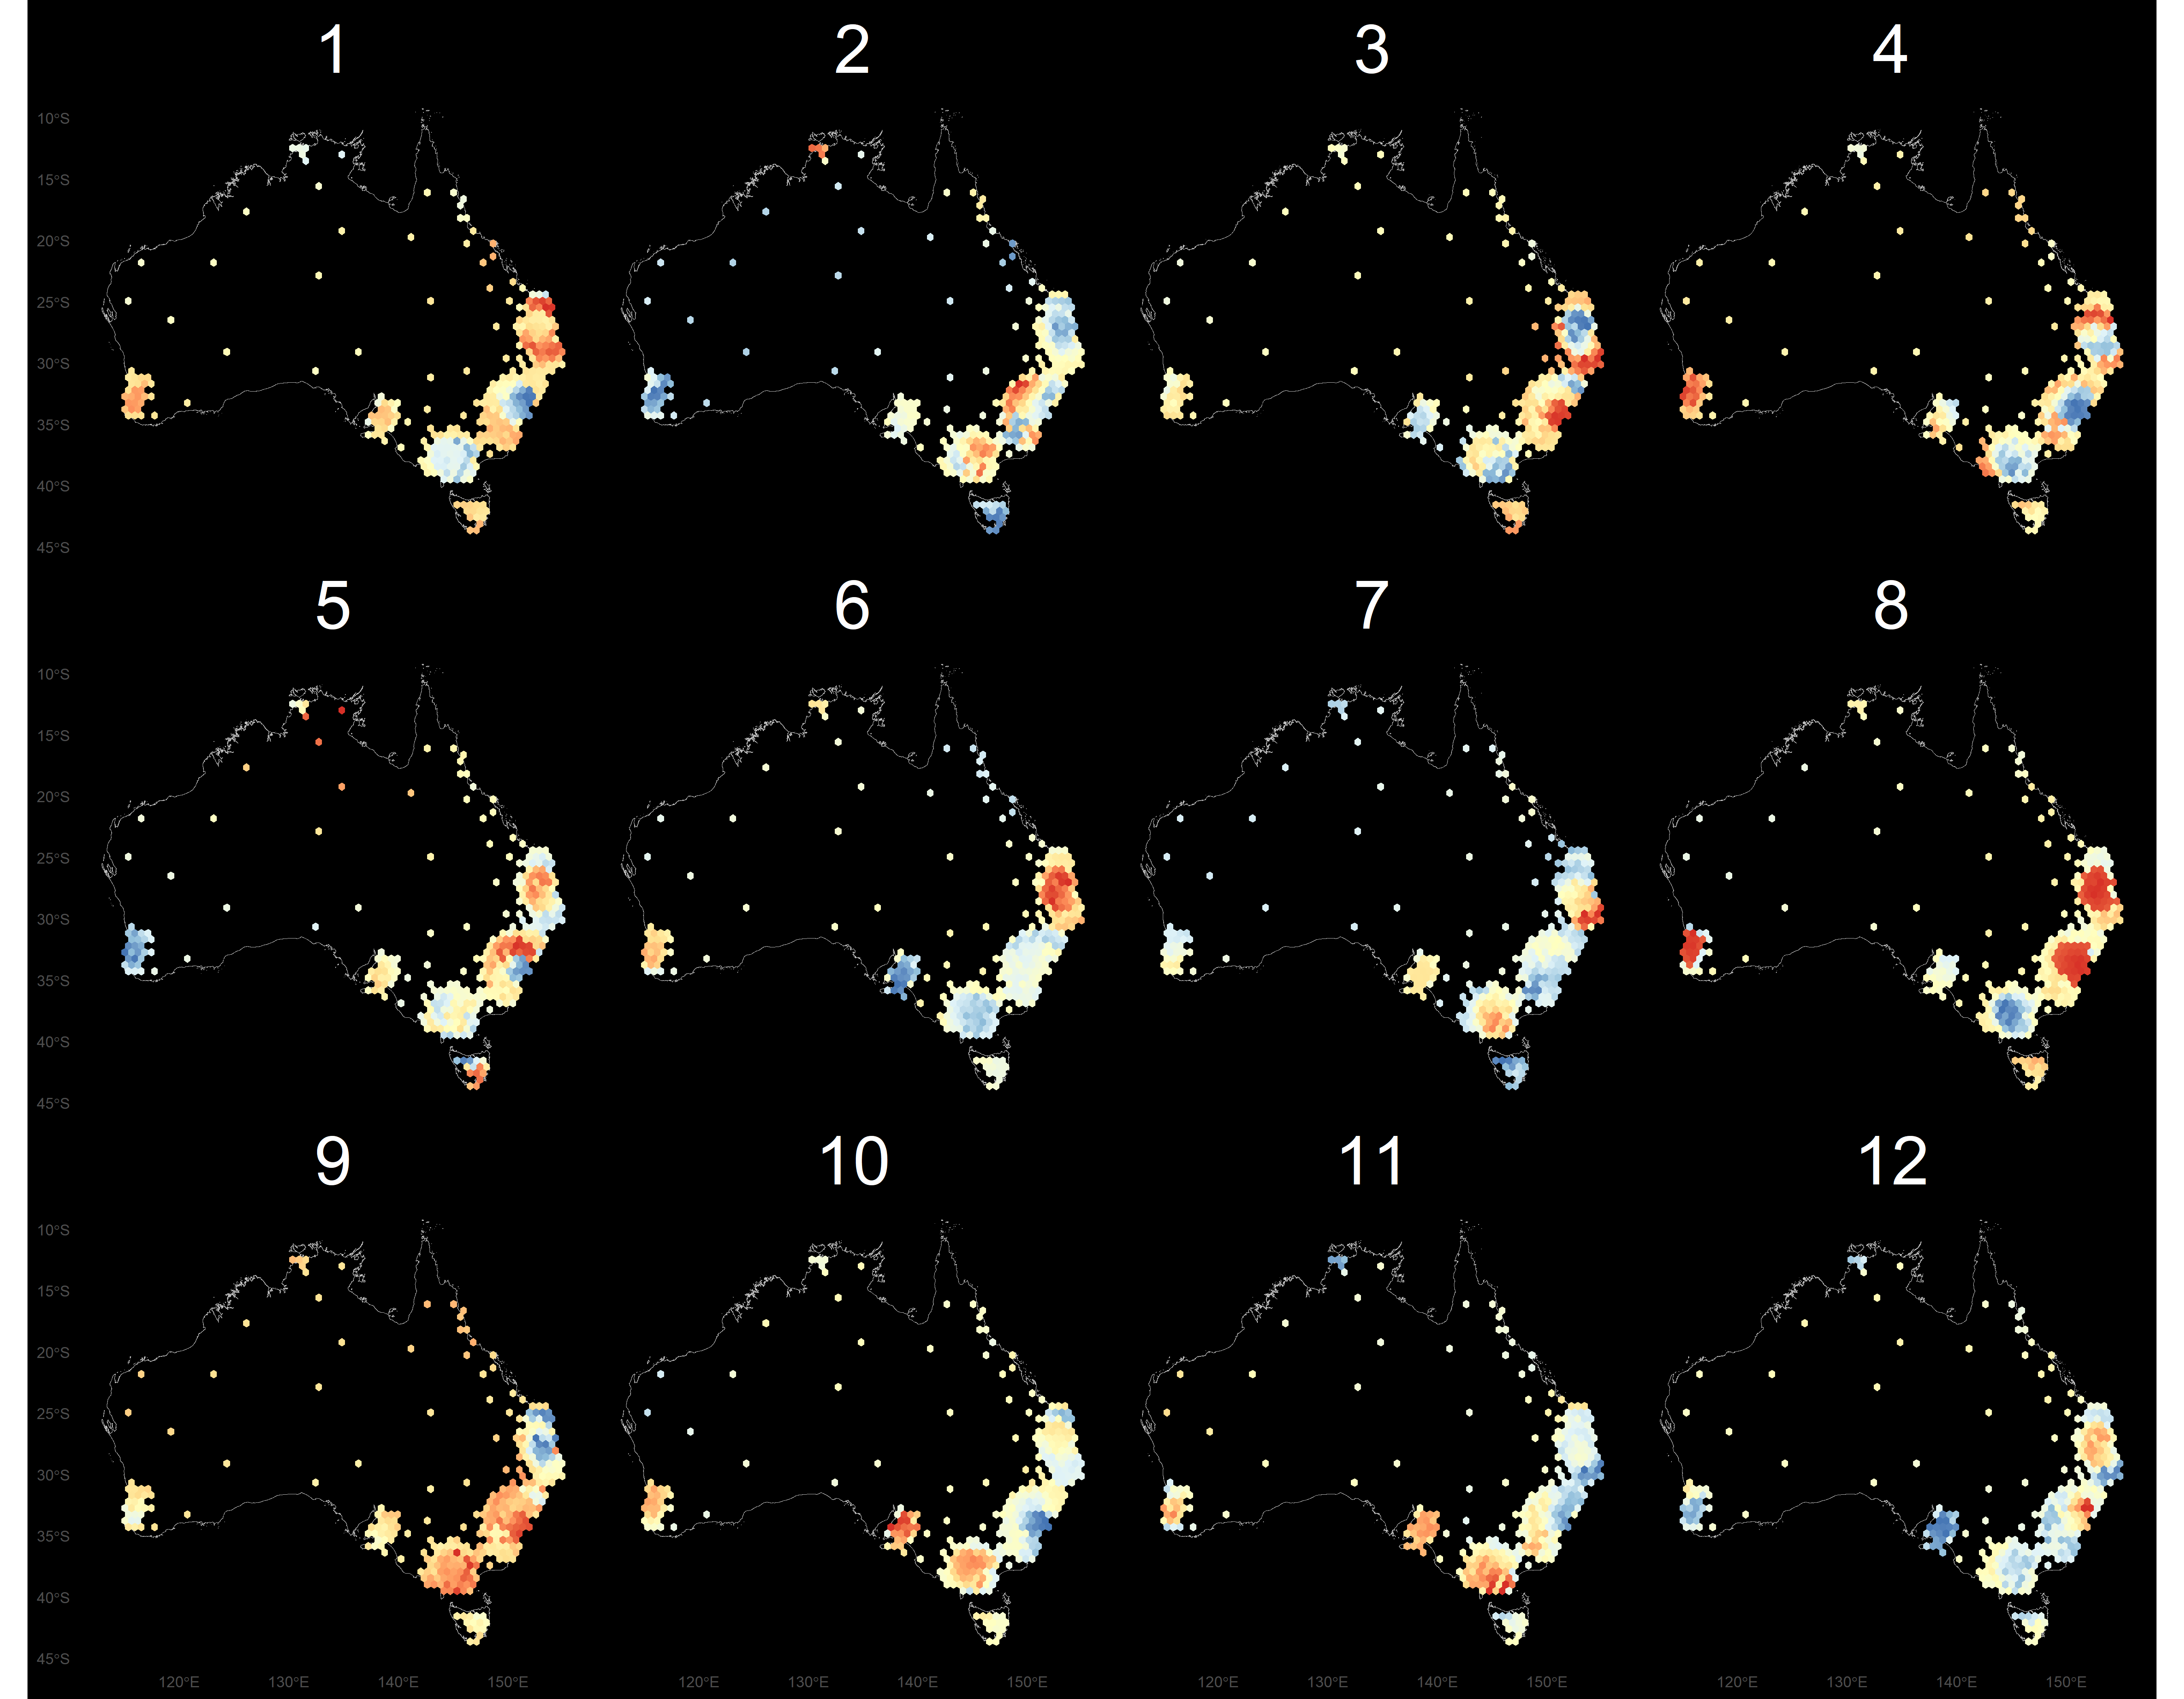
Answers
- In both of these lineups the data plot is in position 8.
- The first display is a choropleth map, where big spatial areas dominate.
- The second display is a hexagon tile map, a new display that we have designed for Australian disease communication.
Thyroid cancer incidence
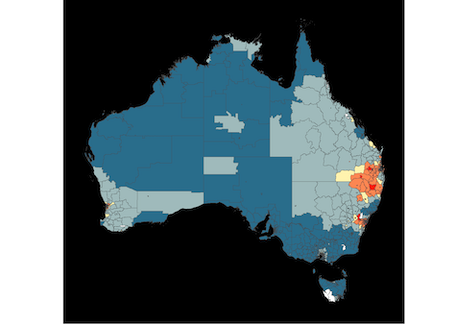
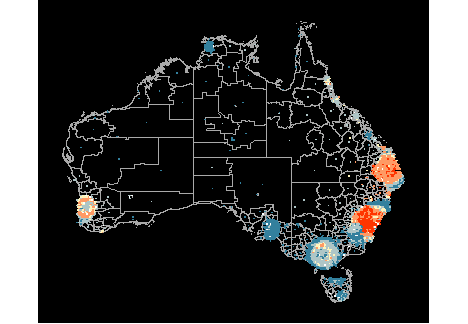
The work is motivated by the Australian Cancer Atlas. Our experiment, using lineups showed that the hexagon tile map more effectively communicates the distribution of cancer incidence.
Kobakian and Cook (unpublished) https://github.com/srkobakian/experiment
What's that you say? That people can't look at so many plots?
What's that you say? That people can't look at so many plots?
Crowd-sourcing can help here.
Validation experiment
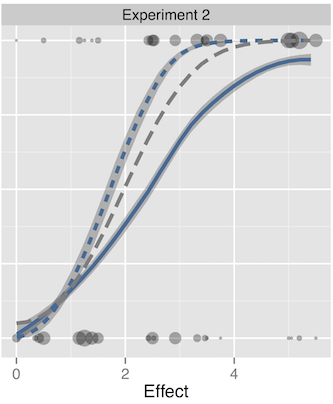
Majumder et al (2013) conducted validation study to compare the performance of the lineup protocol, assessed by human evaluators, in comparison to the classical test, using subjects employed with Amazon's Mechanical Turk.
Explanation of experiment
Read about it at http://datascience.unomaha.edu/turk/exp2/index.html
Ho:βk=0 vs Ha:βk≠0
- 70 lineups of size 20 plots:
- n=100,300
- β∈[−6,4.5]
- σ=5,12
- 351 evaluations by human subjects
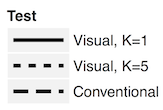
Power analysis of human evaluation relative to classical test.
Effect =√n×|β|σ
Pooling the results from multiple people produces results that mirror the power of the classical test.
High-throughput analysis
😓
The wasps example made us worried about our own RNA-Seq analyses!
Lineup of our own data
I'm going to show you a page of plots
Lineup of our own data
I'm going to show you a page of plots
Each has a number above it, this is its orange[id].
Lineup of our own data
I'm going to show you a page of plots
Each has a number above it, this is its orange[id].
Choose the plot that you think exhibits the
- steepest green line
- with relatively small spread of the green points
Lineup of our own data
I'm going to show you a page of plots
Each has a number above it, this is its orange[id].
Choose the plot that you think exhibits the
- steepest green line
- with relatively small spread of the green points
Ready?
Experimental design 2x2 factorial:
- Two genotypes (EV, RPA)
- Two growing conditions (I, S)
- Three reps for each treatment
- Approx 60,000 genes
Results from two different procedures, edgeR and DESeq provided conflicting numbers of significant genes, but on the order of 300 significant genes.
One of the top genes was selected for the lineup study, and independent observers engaged through Amazon's Mechanical Turk.
How does a
discrepancy
happen?
Turk results
Is there any significant structure in our data?
Turk results
Is there any significant structure in our data?
- 24 lineups were made, only one shown to an observer
- 5 different positions of the data plot
- 5 different sets of null plots
Pooling results gave a detection rate of 0.65, which is high. There is some structure to our data.
Two aspects of massive multiple testing
- ruler on which to measure difference === empirical Bayes
- false positives === False Discovery Rate
Two aspects of massive multiple testing
- ruler on which to measure difference === empirical Bayes
- false positives === False Discovery Rate
Even with these, mistakes can happen, and visualising the data remains valuable.
How to do this yourself
Get a copy of the nullabor package
install.packages("nullabor")or
# install.packages("remotes")remotes::install_github("dicook/nullabor")Look at the "Get started" documentation at http://dicook.github.io/nullabor/index.html
Thanks for listening!
Here's what I hope you heard:
- Plots can be embedded into an inferential framework
- This extends the applicability of statistics to more complex problems
- Crowd-sourcing can help manage plot evaluation
Additional reading
^ Buja et al (2009) Statistical Inference for Exploratory Data Analysis and Model Diagnostics, RSPT A
^ Wickham et al (2010) Graphical Inference for Infovis, TVCG
^ Hofmann et al (2012) Graphical Tests for Power Comparison of Competing Design, TVCG
^ Majumder et al (2013) Validation of Visual Statistical Inference, Applied to Linear Models, JASA
^ Yin et al (2013) Visual Mining Methods for RNA-Seq data: Examining Data structure, Understanding Dispersion estimation and Significance Testing, JDMGP
^ Zhao, et al (2014) Mind Reading: Using An Eye-tracker To See How People Are Looking At Lineups, IJITA
^ Lin et al (2015) Does host-plant diversity explain species richness in insects? Ecological Entomology
^ Roy Chowdhury et al (2015) Using Visual Statistical Inference to Better Understand Random Class Separations in High Dimension, Low Sample Size Data, CS
^ Loy et al (2017) Model Choice and Diagnostics for Linear,
Mixed-Effects Models Using Statistics on Street Corners, JCGS
^ Roy Chowdhury et al (2018) Measuring Lineup Difficulty By Matching Distance Metrics with Subject Choices in Crowd- Sourced Data, JCGS
^ Vanderplas et al (2020) Testing Statistical Charts: What Makes a Good Graph? ARSIA
^ Vanderplas et al (2021) Statistical significance calculations for scenarios in visual inference. Stat.
Acknowledgements
Slides created via the R package xaringan, with wattle theme created from xaringanthemer.
The chakra comes from remark.js, knitr, and R Markdown.
Slides are available at https://dicook.org/files/NCB2021/slides.html and supporting files at https://github.com/dicook/NCB2021.

This work is licensed under a Creative Commons Attribution-ShareAlike 4.0 International License.
Image credit: Di Cook, 2018