A Disturbing Case of Academic Theft
arxiv
publishing
journals
review
statistics
machine learning
science
research
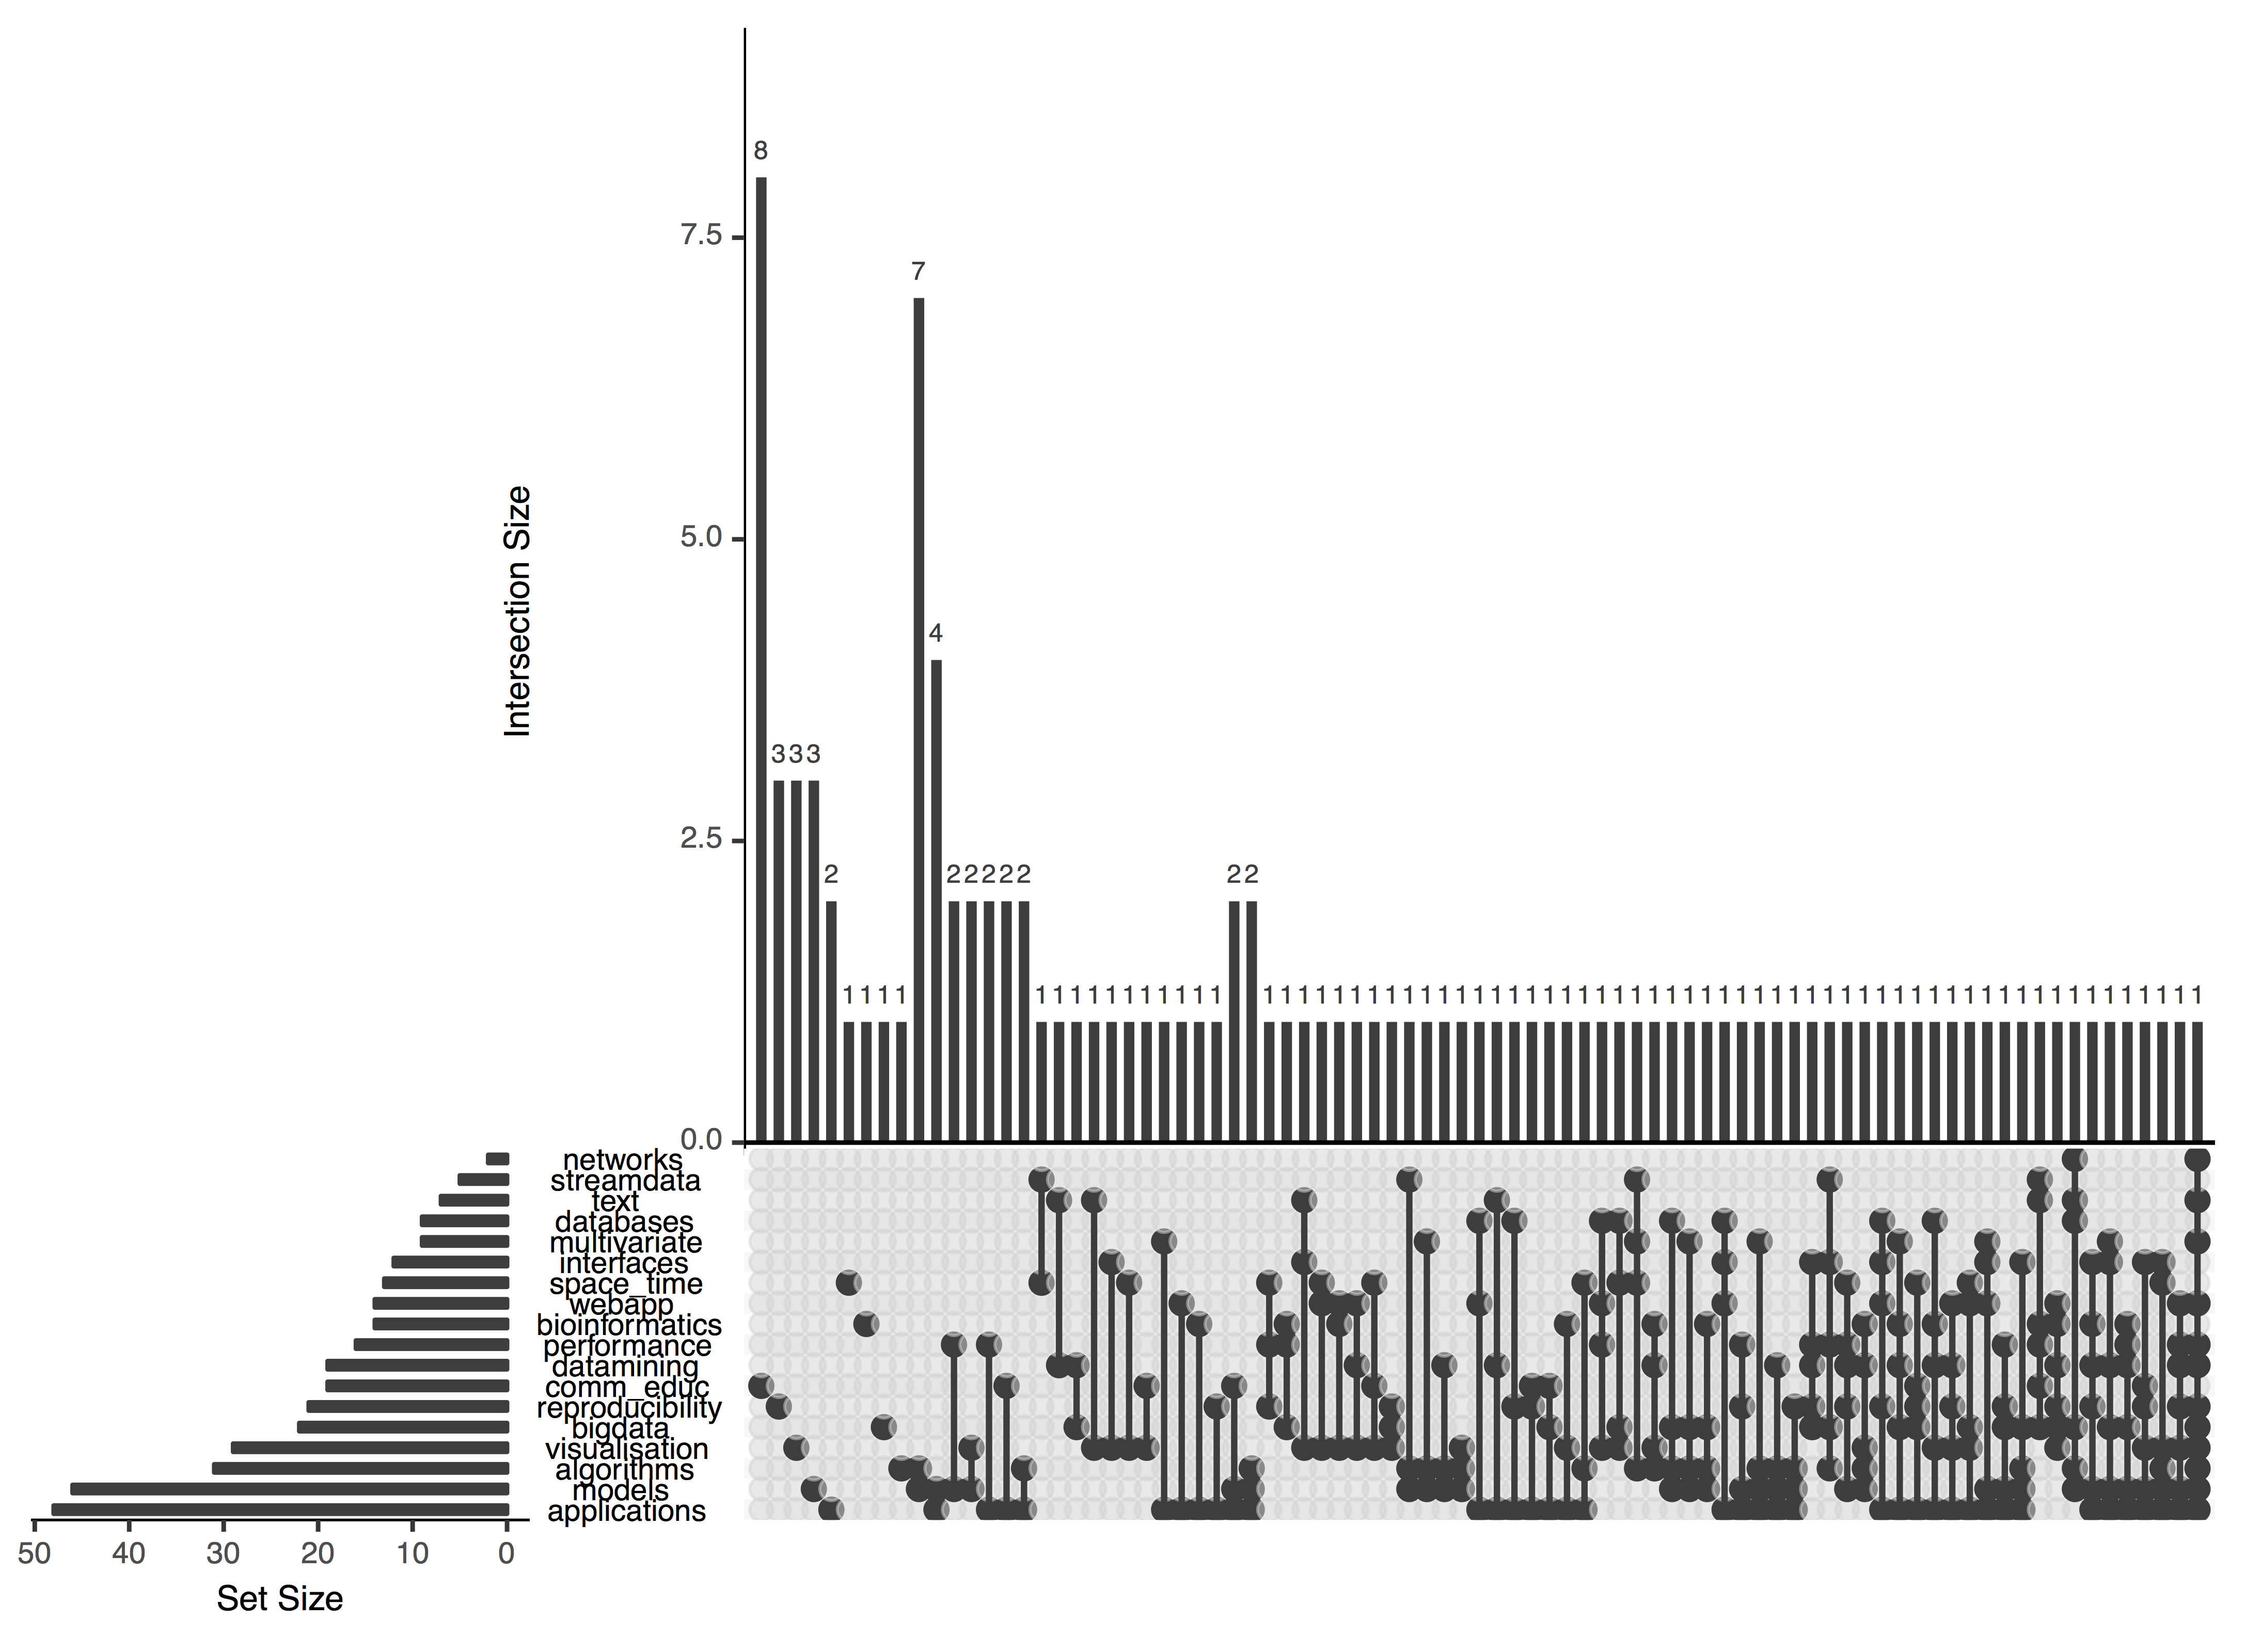
Phase transitions in Stochastic Gradient Descent, from a High-dimensional Data Visualisation Perspective
R
high-dimensional data
deep learning
data visualisation
statistical graphics
dimension reduction
tours
data mining
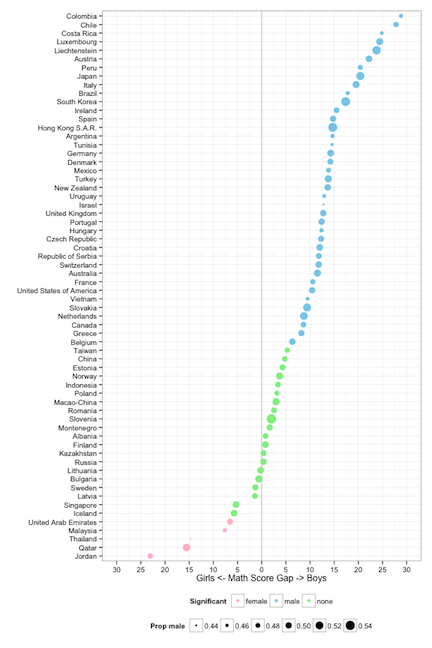
What is EDA, really?
R
data science
descriptive statistics
exploratory data analysis
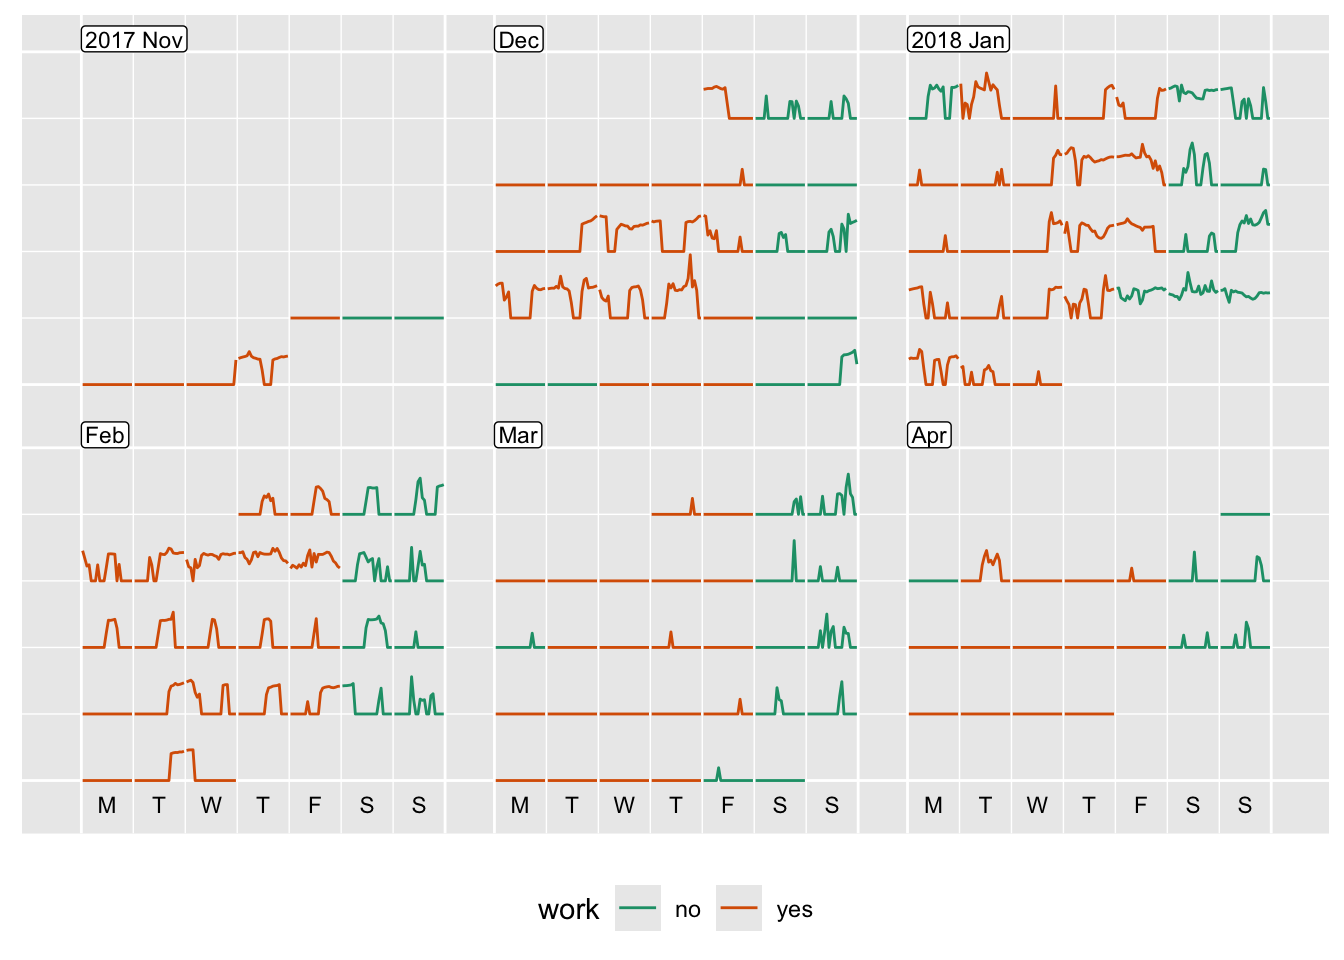
Analysing my energy usage
data visualisation
R
tidyverse
time series
smart meter
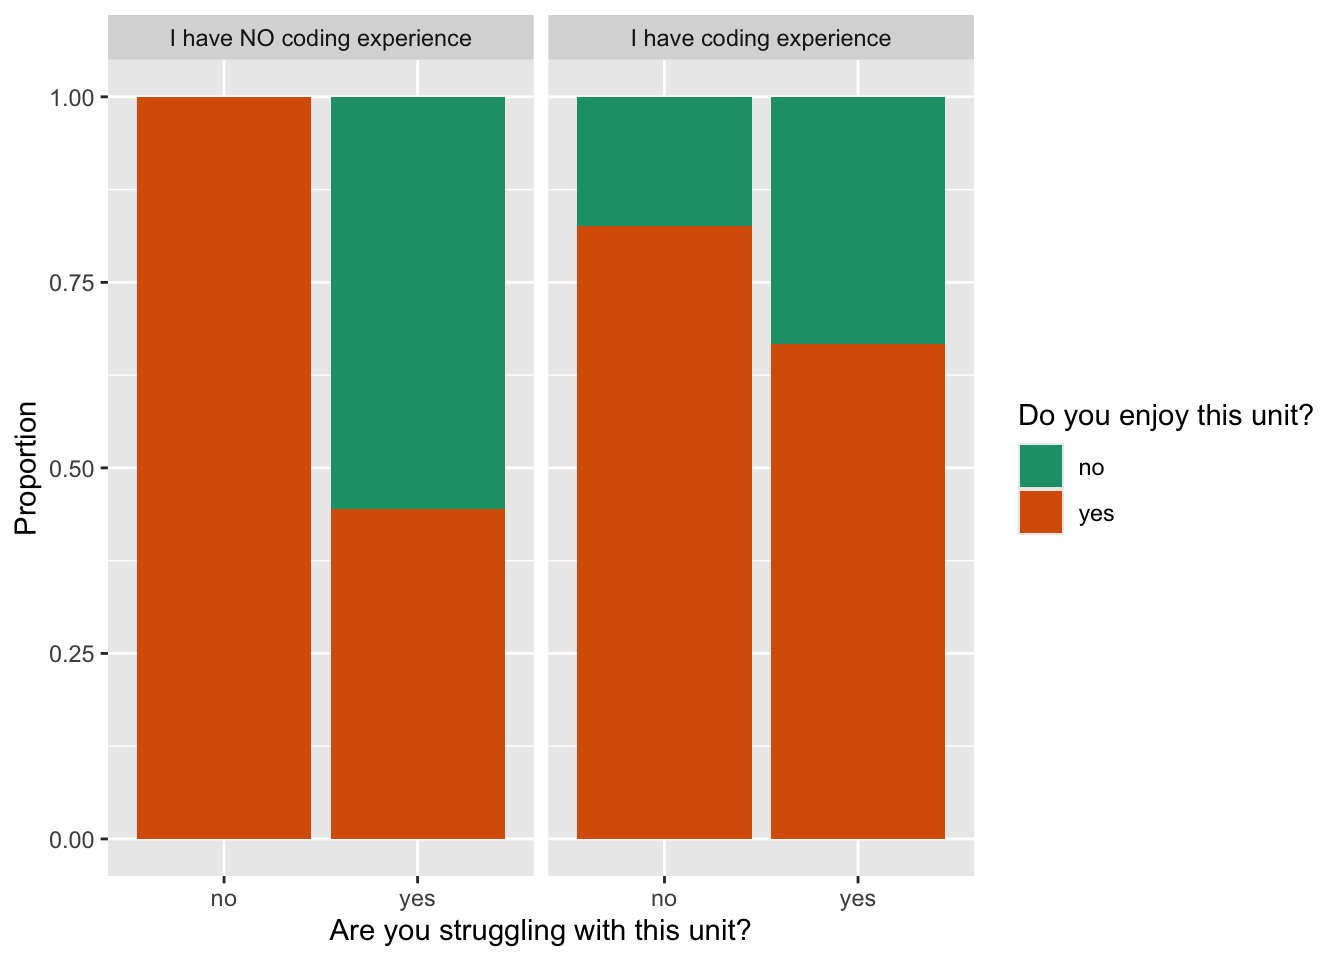
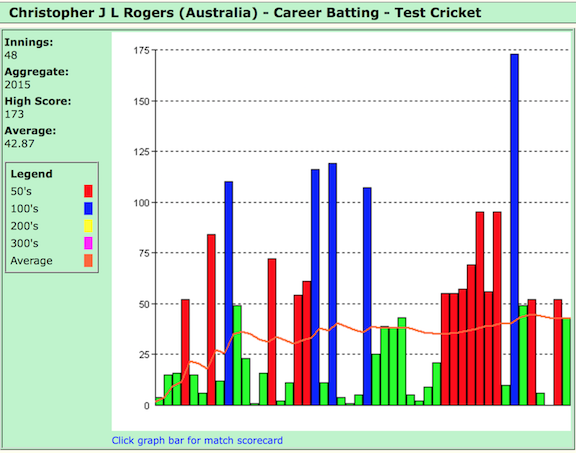
Rookie mistakes and how to fix them when making plots of data
education
statistical graphics
data visualisation
R
ggplot2
No matching items